The FCC finally received authorization from Congress and the White House to issue licenses from Auction 108 (which happened almost two years ago). T-Mobile won the vast majority of these licenses.
The licenses were issued on Leap Day (2/29/24) but didn’t flow into the map automatically because the FCC insisted on organizing the data differently for those licensees in the database.
Additionally, the FCC licensed the Auction 108 areas based on county boundaries. However, those boundaries changed over time, and the county boundaries of 1990 (which serve as the baseline for BTA, the license area type for EBS/BRS) are different from today. So, additional work needed to be done to roll back any county boundary or name changes from today to 1990 (looking at you Alaska, revamping a third of your state’s county boundaries!).
Finally, as a reminder, these licenses are overlay licenses. While you see them attached to counties, and the FCC ULS Maps may indicate an entire county, they are limited based on previously issued licenses for the same frequencies.
May 2022 Update – P35 Boundaries
Improved BRS/EBS P35 Boundaries
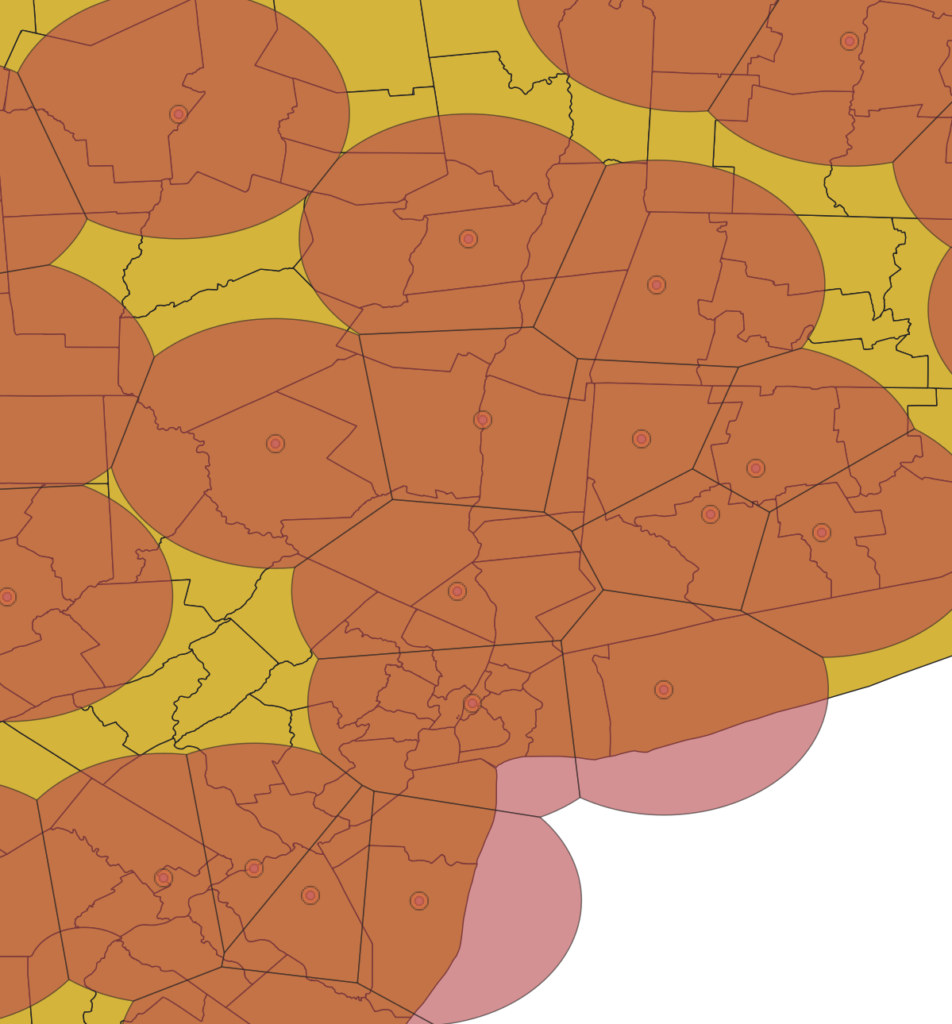
BRS and EBS licenses are licensed in a variety of ways (and the upcoming Auction 108 will add another way – counties). One of the way they’re licensed is a Point-Radius method referred to as P35 (point and a 35 mile radius). Licensees define a point, and have the 35 mile radius around that point as their licensed area. However there are lots of cases when those licenses overlap. Which can make it tricky to know which license is the correct one for a given location.
Using a “splitting the football” technique to intersect P35 point/radius license areas, I am better able to determine the county/license relationship. Counties in metropolitan areas will have less noise and more signal (ha ha) as far as which licenses are applicable for that area. In very dense areas, like the picture below, you can see that it becomes less of “splitting the football” and more of just trying to determine the midpoint between all the intersecting points and drawing lines through the midpoints to generate a set of boundaries that are correct.
This was a particularly fun problem to solve. It took a while, as the spatial analysis tools in SQL Server weren’t adequate and I had to spin up a different database to accomplish it.
These improvements will be deployed by the end of May!
More improvements to come soon!
February 2022 Update
I’ve nearly completely rewritten the JavaScript for pulling the data, storing it, and generating the geometry for the website. The goal was to reduce the memory and CPU usage of the website (which is probably more impactful on mobile devices and tablets). I’ve also finally ditched KML data files for the geometry base and moved to GeoJSON. The benefit – reduced memory usage!
The old website would start by using about 300-350MB of memory after the initial load, and increase from there. Each map change would add to the memory used (this is known as a memory leak).
The new website starts the same – around 300-350MB of memory, but once the data is stored on disk (instead of in memory) and garbage collection runs in the background, the memory usage decreases and stays between 150-200MB. Even as maps types change and different tabs are used, Chrome indicated that memory usage was still between 150-200MB.
The other update for this month is a small tweak to ownership data – I’m a little more particular about how I go about assigning subsidiaries to the major carriers to try and make sure that they own a controlling fraction ( >= 50%) of the subsidiary before I assign it to them. There are some small cell phone companies out there that have a major carrier (Verizon) that owns a small fraction of the company (10%). But those shouldn’t be assigned to Verizon.
The next few changes are more behind the scenes. Hopefully some more user-facing changes this summer.
If you happen to notice any problems with the new system, please let me know here.
January 2022 Update
This month I will be adding the new 3.45GHz band (100MHz) to the map as the FCC recently released auction results. I’ve validated that the results posted will work for the map, but it will take a few hours to get it coded and tested. Expect the new layer in a week or two, as most of my house is sick.
December 2021 Update!
Hi everyone!
I’ve spent the last few months working hard on cleaning up the BRS/EBS data. The more I dug, the more I found I had to correct for.
BRS/EBS
There are very few licenses that still use the “Old” band plan. Virtually all the licenses are using the “New” band plan (there have been many recent conversions, even in the last few months – as I was combing through the data I saw a lot of October and November 2021 dates for some licenses switching from Old to New). Be aware there are still inconsistencies in the FCC’s ULS database – there are lots of licenses where it says they’re using the New band plan but have the Old frequencies associated on the Map view of the license.
I’m convinced at this point that T-Mobile doesn’t own those J/K blocks. I’ve checked everywhere in the FCC data dump and didn’t find any records that showed they own those J/K blocks.
Next on the agenda for BRS/EBS is to start using spatial analysis to “split the football” on overlapping P35 licenses. I used to do spatial analysis for a living so I’m eager to get back into it and figure out how to solve this problem. If I’m successful I do plan on trying to make a BRS/EBS map, but it will be paywalled after a short beta period.
Firstnet
I’ve added AT&T’s Firstnet holdings. However, they still don’t appear in the FCC ULS data dump, so there are no hyperlinks to link back to.
Thats all, have a great holidays and let’s hope 2022 can return us to a little bit more normal times.
September 2021 update
Hi everyone. Small bug fix delivered this month. The totals on the Depth chart for mmWave were off, and I’ve corrected the algorithm to total it up. So the numbers should be correct as of today’s data update.
Other issues I am looking into are J/K blocks of EBS/BRS control for T-Mobile (the FCC ULS doesn’t show any license ownership for those blocks prior to 2020’s tribal lands assignment action so I’m not sure T-Mo owns or leases those two small chunks), and improving P35 boundaries using the splitting the football approach the FCC defines for when the two circles overlap.
Finally I’m looking into developing a more detailed EBS/BRS map. Though given the time investment, those features might be paywalled for licensed users only.
C-Band results posted [U]
By the end of June, I expect that I will be able to post the C-Band auction results. [Update: As of June 17, I have posted the results in map form!] The results will include both the final and interim configuration. If you haven’t heard, Verizon was the big winner, both in terms of spectrum and money paid, getting about 160Mhz of spectrum nationwide. AT&T was next with around 80Mhz, and then finally T-Mobile got about 40Mhz or so in major markets.
Interim vs. Final Configuration
The interim configuration extends from December 2021 to December 2023, and includes the first 100MHz (A block) of the C-Band’s 280MHz available spectrum for cellular use, but only in specific metro areas (the top 50 in the US, excluding Washington DC/Baltimore). This interim configuration was split between Verizon and AT&T 60/40. On the map you’ll see two sets of blocks for the first 100MHz – one block has an “Int” at the end which denotes the “interim” block that has the reduced metro areas as well as assignments for the next two years, as well as the “final” block which has the block name “A1” to show the 2023 configuration.

This spectrum has a lot of potential – greenfield 5G for Verizon and AT&T, and enough spectrum to make 5G seem like 5G, and not just 4G with Sprinkles.
The next auction is the in-fill for the 2.5GHz band. Will T-Mobile extend their dominance, or will small rural carriers try to secure large blocks of mid-band spectrum to deploy rural wireless (fixed wireless maybe?).
CBRS Auction results now available
Results of the CBRS auction are now available on the maps. The licenses were auctioned off at the county level (PEA/2017 counties). The FCC still has not made their licenses available in the ULS system so there is no link to the official FCC license in the ULS.
The licenses are 10MHz chunks each, but they aren’t assigned a specific frequency block. The spectrum licensees have purchased a “Priority Access” license, which means that they have priority over General Access users (and the former users of the spectrum have priority over both groups). Instead, all users of the spectrum will use a “SAS” or Spectrum Access System in order to coordinate frequency usage in each county. Out of the 100MHz available (3550-3650MHz) there were 7 10MHz licenses available. Most of the winners were cable TV companies (Charter, Comcast. Cox), Verizon, Dish, and a host of other smaller companies or companies looking to eventually resell the spectrum licenses for a profit.
Spectrum Map – November 2020 updates
First, I have added J/K bands for BRS/EBS, as well as now supporting tribal lands which were just recently granted a month or two ago. There will be an auction of the remaining 2.5GHz BRS/EBS spectrum in 2021.
Next, SMR (original and rebanded) 800MHz is now supported on the map and in the depth chart. This is mostly owned by T-Mobile (via Sprint). I have removed some of the SMR bands that were not showing up on the map, but very few licenses are affected and most of them were less than 1 MHz wide so they aren’t usable for cellphones (LTE/5G).
I missed Washington, DC in the depth chart originally, but its there now.
Finally, I’ll be removing the “BETA” tag on December 1 from the County-level data maps. Thanks to everyone who emailed me with issues or items for me to check on. I appreciate it.
I’m publishing a bit early because its close to Thanksgiving and I don’t think I’ll be getting any free time to spend on the site until December.
CBRS licenses still aren’t in the FCC ULS, even though the winners at the county-level have been available for months. This section of spectrum will be difficult to chart because the licenses are not the same as all the others – they’re “priority access” licenses because there is incumbent use in this space. And there is no specific chunk of spectrum assigned to them (e.g. 3550 – 3560MHz), there are just seven 10MHz licenses per county and that’s it. I don’t know if I can get access to a SAS and be able to snapshot the county-level data in the US once a week.
2.5GHz Tribal Priority Results
I’ve been working for a bit working to add the 2.5GHz Tribal Priority Window license allocations added to the maps. It’s a bit tricky since each tribe has their own license area, along with a number of … um, discrepancies as far as I can tell the in the FCC ULS system.
Check out call sign WRJS797, the FCC lists Tribal Priority Window (TPW) channels for about 67MHz, but the Maps page, it displays about 117MHz of licensed spectrum, which means the main page is missing the first ~50MHz of licensed spectrum (2502MHz to 2551.5MHz). The application in the ULS lists all of the licensed spectrum noted on the Maps page (117MHz).
Maybe this will be ironed out in a few weeks, but the data will be a bit rough until then.